To document a duty cycle quickly like a lab pro, connect your oscilloscope or logic analyzer to your signal, set the right time and voltage scales, and measure the on-time and total period visually or with automatic tools. Record these values systematically, noting test conditions and timestamps. Use software for waveform analysis and generate reports to save time. Keep practicing these steps, and you’ll master efficient, accurate documentation in no time. Stay tuned for detailed tips on streamlining your process.
Key Takeaways
- Use an oscilloscope to capture and measure the waveform’s on-time, off-time, and period for accurate duty cycle calculation.
- Employ built-in measurement tools or software features to automate duty cycle analysis and record results quickly.
- Document measurement settings, environmental conditions, and timestamps for comprehensive and reproducible records.
- Save waveform screenshots, measurement data, and generate reports to streamline documentation within 10 minutes.
- Organize and export data into clear logs or reports, ensuring quick sharing and future reference like in a lab setting.
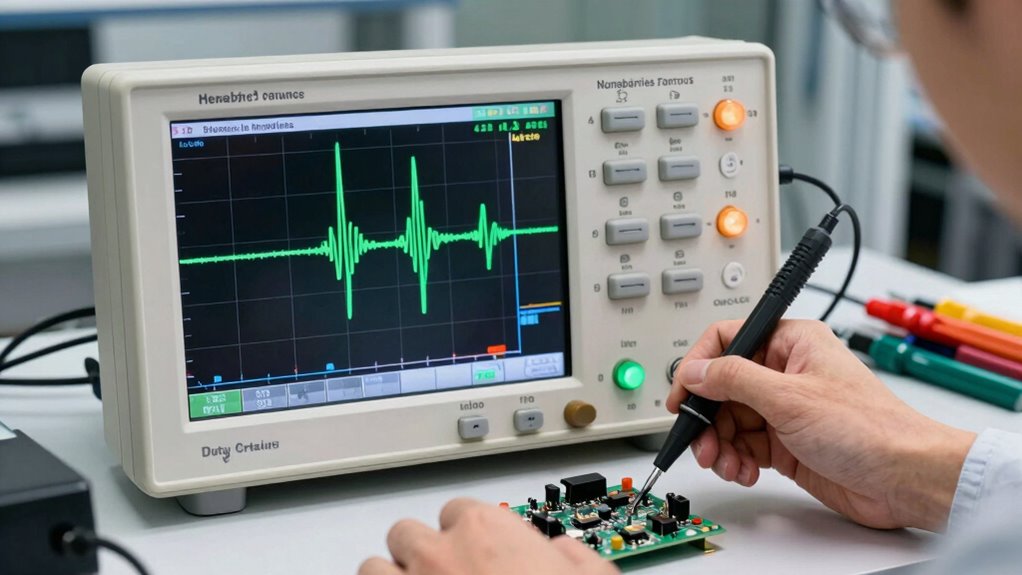
Have you ever wondered why accurately documenting duty cycle in labs is so important? When you’re working with electronic components or testing equipment, knowing the precise duty cycle helps you interpret results correctly, ensure safety, and maintain consistency across experiments. Proper documentation can also help troubleshoot issues later on and improve your overall understanding of circuit behavior. To do this efficiently, you need effective measurement techniques and reliable software tools that streamline the process. Additionally, understanding the digital signal properties is crucial for accurate measurement and documentation.
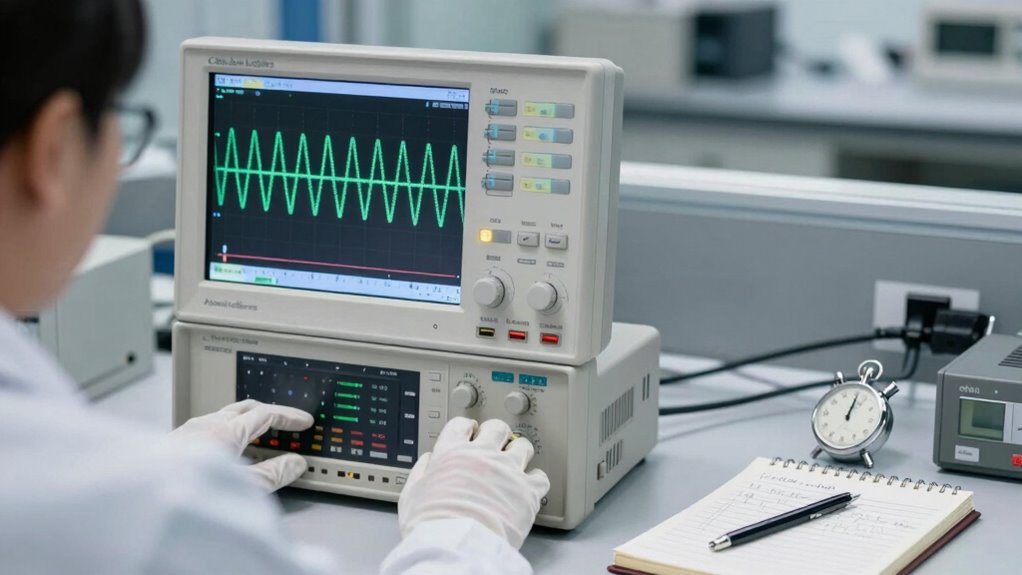
The first step is selecting the right measurement techniques. Using an oscilloscope is common, as it allows you to visualize the signal waveforms directly. With an oscilloscope, you can measure the high (on-time) and low (off-time) durations of your signal, then calculate the duty cycle by dividing the on-time by the total period. Make sure your oscilloscope is set to the appropriate time and voltage scales for accuracy. Some advanced oscilloscopes offer automatic measurement features, which can quickly provide duty cycle readings without manual calculations. Alternatively, if you’re working with digital signals, a logic analyzer can give you a clear view of high and low states, making it easier to determine duty cycle, especially for high-frequency signals.
Once you’ve captured your measurements, software tools come into play. Many oscilloscopes and data acquisition devices come with built-in or compatible software that can automatically analyze waveforms and calculate duty cycle. These tools often feature automated measurement functions that reduce human error and save time. For example, you can set up your software to record multiple cycles, average the duty cycle, and generate logs for documentation. Some software also allows you to overlay multiple waveforms, compare duty cycles under different conditions, or export data into reports. This integration of measurement and documentation streamlines your workflow and ensures accuracy.
To make the process even quicker, familiarize yourself with shortcuts and automation features within your measurement tools. Setting up templates or presets for common tests helps you skip repetitive setup steps. When documenting, always ensure your software logs include time stamps, measurement parameters, and environmental conditions—details essential for repeatability and troubleshooting. Using software tools also enables you to store data securely, share it with colleagues, or include it directly in reports, saving you time and effort.

FNIRSI 2C53T 3-in-1 50MHz 2CH Oscilloscope Multimeter DDS Signal Generator
- Updated Version: Enhanced measuring range and new features
- Dual-Channel Oscilloscope: 50 MHz bandwidth, 250 MSa/s sampling rate
- Waveform Storage: Supports image storage and export
As an affiliate, we earn on qualifying purchases.
As an affiliate, we earn on qualifying purchases.
Frequently Asked Questions
What Tools Are Best for Measuring Duty Cycle Accurately?
You should use a high-quality oscilloscope with proper calibration to measure duty cycle accurately. Make certain your oscilloscope is calibrated regularly for precise readings. Combine this with signal analysis techniques like setting the correct time base and trigger levels. These tools and methods help you analyze waveforms precisely, giving you reliable duty cycle measurements. Investing in good equipment and following calibration procedures ensures consistent, accurate results for your duty cycle documentation.
How Do Temperature Variations Affect Duty Cycle Measurements?
Imagine measuring a duty cycle in a high-power LED circuit; temperature fluctuations can skew your results. As thermal stability decreases, components heat up unevenly, causing resistance changes that affect measurements. These temperature variations lead to inaccurate duty cycle readings, so you should account for thermal stability in your setup. To guarantee precision, monitor temperature changes and perform measurements in a controlled environment to minimize the impact of thermal fluctuations.
Can Duty Cycle Be Adjusted During a Live Experiment?
Yes, you can adjust the duty cycle during a live experiment using digital oscilloscopes. By performing waveform analysis, you can observe real-time changes and tweak your signals accordingly. Many oscilloscopes allow you to modify parameters on the fly, ensuring your duty cycle aligns with your desired specifications. This flexibility helps you optimize performance and gather accurate data without stopping the experiment.
What Are Common Mistakes When Documenting Duty Cycle?
Missing details or inconsistent measurement techniques can lead to flawed documentation. You might overlook recording the exact on/off times or fail to note the measurement method used, which hampers reproducibility. To avoid these mistakes, follow documentation best practices by clearly recording duty cycle parameters, using precise units, and maintaining consistency. This guarantees your data remains reliable and understandable, preventing misinterpretations in future analyses or experiments.
How Do I Verify the Accuracy of My Duty Cycle Readings?
To verify your duty cycle readings, start with duty cycle calibration using a reliable oscilloscope. Check signal stability by observing the waveform over multiple cycles, ensuring consistent high and low states. If the readings fluctuate, recalibrate your instrument and confirm connections. Comparing measurements with a known reference or using software tools can also help guarantee your duty cycle data is accurate and reliable.

Zeroplus Logic Analyzer – Lap-C Pro 32-Channels, 256Mb per Channel, Digital Signals Measurement, Protocol Analysis, Portable and Hardware Debugging
- Number of Channels: 32 channels for comprehensive analysis
- Memory Capacity: 256Mb per channel, 8Gb total
- Protocol Trigger Support: Hardware-based data value triggers
As an affiliate, we earn on qualifying purchases.
As an affiliate, we earn on qualifying purchases.
Conclusion
Now you’re all set to document a duty cycle effortlessly. Just remember, clear, precise notes are your superpower—think of it as the GPS guiding anyone through your lab work. With practice, your documentation skills will shine brighter than a lighthouse in a storm, making complex data look simple and manageable. So keep it concise, accurate, and confident. Before you know it, you’ll be the maestro of lab documentation, turning chaos into clarity faster than you can blink!

Pico Technology PicoScope 4824A Oscilloscope 8 Channel 20 MHz USB PC Lab Scope Kit with Probes, PS7 Software and Waveform Generator
- Series Type: PicoScope 4000A Series
- Bandwidth: 20 MHz
- Sampling Rate: 80 MS/s
As an affiliate, we earn on qualifying purchases.
As an affiliate, we earn on qualifying purchases.
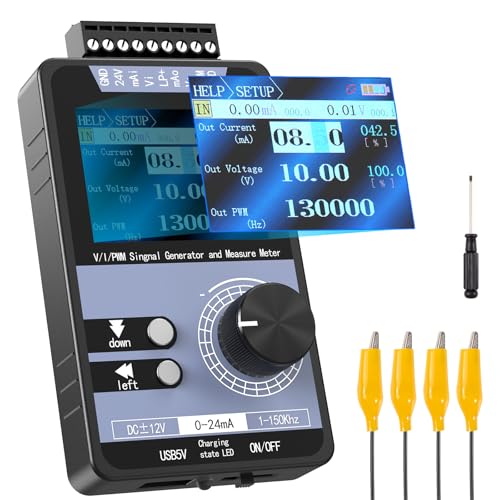
Riiai 4-20mA Signal Generator: Supports Voltage and Current Output/Measurement, PWM Output, Function Generator with Rechargeable Battery, Calibration Function – for Electronic Maintenance/Testing
- Integrated Multi-Function Device: Current/Voltage output, measurement, PWM
- High-Precision Custom Output: 0-24mA current, ±12V voltage with high accuracy
- Portable Wireless Design: Rechargeable battery, compact and easy to carry
As an affiliate, we earn on qualifying purchases.
As an affiliate, we earn on qualifying purchases.